I’m Tony Duarte, Product Service Manager at Ministry of Justice. I’ve been working on the Prison visit booking exemplar, which has been live since September. As it’s always better to talk not about how to do things, but how they got done, I thought I’d share with you how we used data to identify problems and then solve them effectively.
At the heart of any Minimum Viable Product (MVP) is a hypothesis. To prove or disprove that hypothesis you need data. With Prison visit booking our MVP hypothesis was that a digital service that delivered an email request to booking staff would be more effective than the pre-existing paper and phone-based service.
To test the hypothesis we needed data to analyse the digital service's performance during the alpha phase and for this we had to rely on manual tallies supplied by prison staff.
Two months into the alpha, it became obvious that asking staff to maintain paper based tallies was more than they could deliver. This was partly due to the benchmarking scheme that the Prison Service is undergoing that’s reducing staffing levels in prisons. We had to settle on a one-week snapshot, but that was insufficient and this lack of data was a weak point.
So our developers visited a prison to see what other opportunities there might be to gather metrics. The Prison Service network is not accessible from outside the prisons. Given access to the system from within prison, our developers Jan Szumiec and Mat Harden realised that one of our main assumptions - that prison staff cannot access the internet - was wrong.
Armed with this new knowledge that staff can indeed access the internet from their computers, Jan had a light-bulb moment that would help us gather the metrics we needed. He proposed developing a secure staff-only interface for the prison visit booking application that would provide staff with a booking processing form. It would make the job of responding to requests much quicker and would provide us with valuable metrics, giving a much richer seam of data than the paper tallies.
Once we had whitelisted the web service, we rolled out the new processing form to staff who found it much quicker to use than responding manually to emails. By national rollout in June 2014, the metrics service was up and running and data flowed in. It allowed us to identify prisons that were struggling to meet the 3 day turnaround time for visit requests and gave us insights into the proportion of requests rejected and the main reasons for this.
This data allowed us to initiate discussions with prisons and, in the first wave of interventions, the majority of prisons that didn't meet the 3 day standard were found to still be using paper forms as part of their process. Working closely with our colleagues in the National Offender Management Service (NOMS) we supported prison staff who were concerned about changes to their processes.
Staff from the initial pilot prisons had become strong advocates of change, having been through the same journey of doubting and then embracing the new service design. We facilitated peer-to-peer discussion and support, which was effective in persuading reluctant prison staff to embrace the new service design. This is an ongoing process. Some prisons continued to lag behind in terms of turnaround times. Further investigation revealed short staffing issues, and a problem with our data.
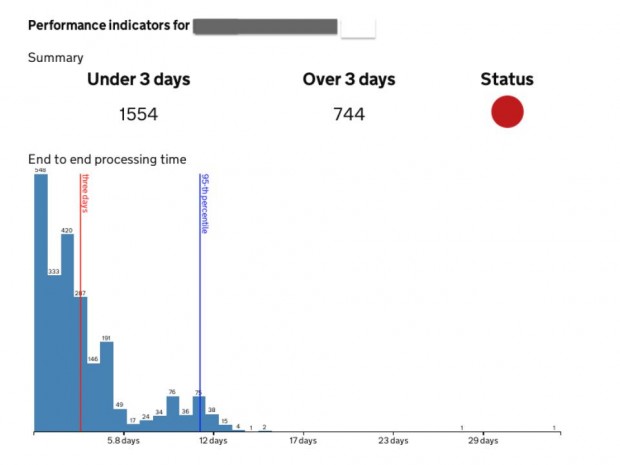
When we approached a number of prisons to support them improve their performance, they countered that they had already reached the standard. So we developed a two-week recent view of the data with graphical visualisations including their RAG status: red, amber, green. Below is a prison's historic cumulative data from early June 2014. The red line shows the 3 day turnaround mark. The blue line the 95th percentile. Ninety five per cent of requests are responded to by this point in time. For the example prison the RAG status is red, as requests have taken more than three days to respond to.
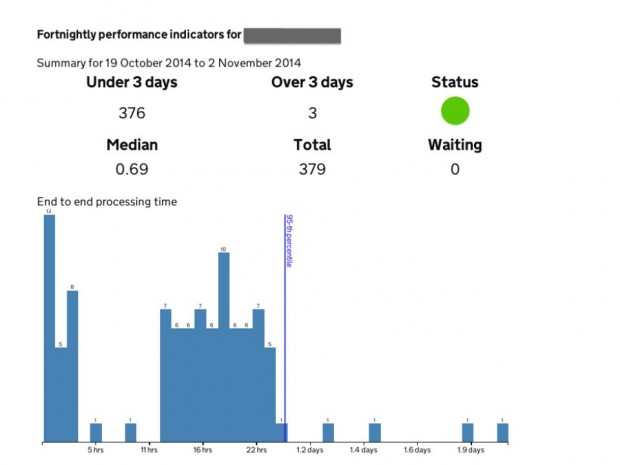
 Contrast it to the two-week view. This prison dealt with under-staffing and focused resources on visit booking. Its RAG status is now green.
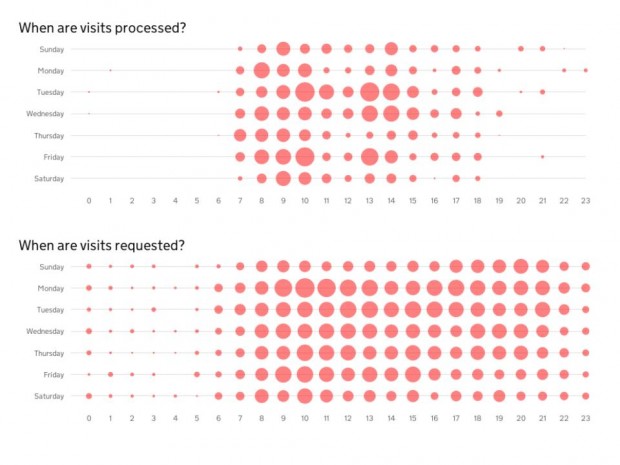
 The following prison enables staff to access the social visits mailbox out of hours when there is spare capacity. Subsequently, they have very fast turnaround times, processing the majority of requests within a day.
 So what does this work data say about our original hypothesis? That it was correct and because the email service is 24 hours, it’s more convenient for visitors and some prisons can use spare capacity in the evenings and weekends to process requests more quickly.
We have now made this data available to prison staff so they can track their own performance and hope to persuade NOMS to make it available to the public through the Performance Platform where we already visualise key KPIs such as digital take-up.
Keep up to date on all things Transformation and sign up for email updates.
1 comment
Comment by Marcel Ramaker posted on
That's a great outcome.